

The Punta Cana Rainy Season Myth: Why the Weather Reports Are Wrong
I'm going to put something in writing that contradicts Weather.com, NOAA, Wunderground, every "best time to visit Punta Cana" blog you've ever read, and — full disclosure — even one of my own pages on this very site.
Here it is: nobody knows how much it rains in Punta Cana. Not Weather.com, not NOAA, not the forecast on your phone. Because nobody is measuring it.
When a website tells you "Punta Cana gets 3.2 inches of rain in October," they are reporting a measurement that was never taken. Nobody here records it. I've lived in this area for 20 years, I'm outside in it almost every day — running, walking, biking — and I went looking for the source of all these confident numbers. There isn't one. The whole "rainy season vs. dry season" story you've been told is built on sand.
Let me show you what I mean.
The numbers don't agree, because there are no numbers
Start with the simplest possible question: how much rain does Punta Cana get in a year? Pull it up from two of the most-cited climate sources online and you'll get two wildly different answers — one models it at around 21 inches a year, another claims around 42 inches.
That's not a rounding error. One "authority" claims twice as much rain as the other for the exact same town. When the experts can't agree within 100% on the single most basic figure, that's your tell. Nobody has the receipts.
Here's why: those figures aren't measured, they're modeled. The popular climate sites pull from satellite reanalysis — global weather models that estimate rainfall across a coarse grid stretching tens of kilometers per square, then print the output as if someone walked outside in Bávaro with a rain gauge. Rainfall is the single hardest thing for that kind of model to get right at a local scale, because the showers here are small, fast-moving, and patchy.
And to be precise, because the distinction matters: there is a weather station at Punta Cana airport — ICAO code MDPC. But it's an aviation station. What it broadcasts is a METAR (Meteorological Aerodrome Report), the standard hourly feed pilots rely on: temperature, wind, visibility, cloud, pressure. A METAR will tell you that it's raining at the moment of the reading — there are codes for light rain, heavy rain, thunderstorms. What it will never tell you is how much rain fell. There is no rain-gauge depth anywhere in that feed. The sensor can see that it's wet; it cannot measure the puddle.
That single blank field is where the whole illusion is born. An automated weather platform ingests the MDPC feed, reaches the rainfall-amount column, and finds nothing there. Rather than print an honest blank, its script fills the hole — usually by grabbing the nearest station that does report a rainfall amount and quietly re-labeling that number as Punta Cana's. The nearest such station sits at Santo Domingo's Las Américas airport (MDSD), the better part of 100 miles away, on the wetter south-central coast. Other platforms skip the substitute station and reach for satellite reanalysis instead — a global model guessing at rain over a grid square tens of kilometers wide. Either way, the chart you're handed for Punta Cana was generated somewhere that is not Punta Cana.
So when a site shows you a tidy month-by-month rainfall chart for this town, understand exactly what you're looking at: guesswork dressed up as data — either Santo Domingo's rain wearing a Punta Cana label, or a satellite's best guess over a grid square.
I'm not going to insult you by publishing my own rainfall chart in response, because I'd be doing the same thing they are — I don't have a rain station either. What I can give you is something none of them have: two decades of living in it, every single day.
Want to see the machinery break? Here's a live example.
If this all sounds abstract, let me show you one of these systems getting it wrong in real time — badly enough that you may never trust a rainfall widget again.
Visual Crossing is a big, low-cost weather-data company. You've probably never heard of it, but it quietly powers the weather numbers behind thousands of other tools — business dashboards, spreadsheet plug-ins, and the travel and real-estate sites that auto-fill "average monthly rainfall" charts on their pages. Pull up their historical-weather page, search "Punta Cana airport," and here is the location their system actually resolves to:
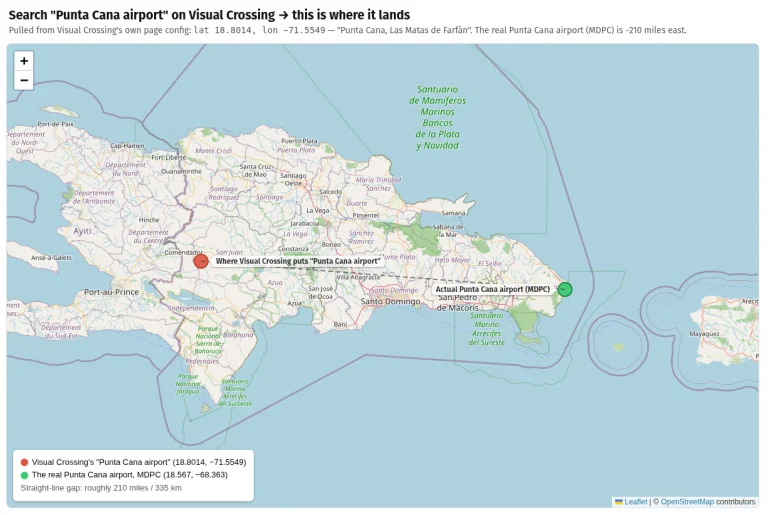
Visual Crossing's own location map when you ask it for "Punta Cana airport." The red dot is parked near San Juan de la Maguana, in the western interior — not the eastern resort coast.
Look at the red dot. That isn't Punta Cana. It isn't even close to Punta Cana. Punta Cana is the far eastern tip of the Dominican Republic, off the right-hand edge of where that dot should be, near Higüey. The dot is sitting in the western interior, beside San Juan de la Maguana, in a rural district called Las Matas de Farfán. The page even admits it in its own title: "Historical weather data for Punta Cana, Las Matas de Farfán, República Dominicana."
That spot is roughly 220 miles west of the real Punta Cana. It is literally closer to Port-au-Prince, Haiti than it is to the beach you're trying to plan a trip to. So every "Punta Cana" rainfall figure that flows out of this system is actually describing a mountain valley near the Haitian border — a completely different climate, hundreds of miles from the coast.
How does a professional weather company end up pointing at the wrong end of the country? The same way as everything else here: no human ever checked it. You typed "Punta Cana airport," the automated parser couldn't cleanly match the airport, so it fuzzy-matched the words "Punta Cana" against its database and grabbed the first thing that fit — an obscure rural section, not the famous resort coast. Nobody looked at the map. The number just gets generated and shipped.
Your phone isn't an exception
Maybe you're thinking: fine, but I just check my phone. So does nearly everyone — and your phone is running the same kind of model.
Open the weather on a Google Pixel or most Android phones and you're looking at Google's own weather, which is fundamentally a forecast model — a simulation of the atmosphere, not a logbook of what a gauge in Punta Cana actually caught. iPhone is the same story: Apple Weather runs on the system Apple built after buying the Dark Sky app, blending the big global forecast models (Europe's ECMWF and America's GFS). When these apps show you "historical averages," they're not reading a Punta Cana rain gauge either — because, as we've covered, there isn't one feeding them. They're filling the same blank with the same kind of model.
This isn't a knock on your phone for telling you tomorrow's forecast — for that, the models are genuinely good. It's specifically the historical rainfall for this one spot that's built on air. Detecting that it's raining, these systems can do. Measuring how much rain actually fell on Punta Cana, nobody is doing.
The regional-data trap
Here's the core mistake baked into every Punta Cana forecast. The model's "region" is the Caribbean — and the Caribbean's calendar says summer-into-fall is hurricane and rainy season, when most of the islands get soaked.
But Punta Cana is not "most islands." It sits in the driest, sunniest corner of one of the driest big islands in the Caribbean. The eastern tip of the Dominican Republic, and the southeastern coast just down the road (Bayahibe, Saona), are noticeably drier than the rest of Hispaniola. When a model applies Caribbean-wide seasonal rules to this little pocket, it gets it wrong — and then a hundred blogs copy the wrong answer from each other.
A simple comparison makes it obvious, and you don't need a single instrument to see it. I spend time in Santo Domingo regularly. The capital is wetter, the rain lasts longer, and when it floods, it floods far worse than here. Same island, three hours apart, completely different weather. The regional models flatten that difference into one number. Reality doesn't.
What rain in Punta Cana actually looks like
This is what the totals could never capture even if someone bothered to measure them. It's not how much it rains — it's how the rain behaves, and what the ground does with it afterward.
In summer, when it rains at all, it's a quick shower. Five minutes, maybe twenty, and it usually comes at night or extremely early in the morning. It rarely rains during the day — you can go weeks without ever seeing a drop fall in the afternoon. It can rain on one side of the street while the other side stays bone dry, and within fifteen or thirty minutes the pavement is dry again and you'd never know it happened. I can wash my car and it stays clean for months. I have to water my grass almost daily or it turns brown. Dealing with rain or flooded streets in summer is simply a non-issue. It just doesn't happen.
Winter is a different animal, and here's the part the "dry season" label hides completely. The problem isn't the rain — it's that Punta Cana has essentially zero drainage, and the flooding is cumulative. If it rains on Monday, the streets are still wet on Thursday. If it rains again before they've dried, the new water just stacks on top of what was already there. I don't stop running or biking because it's raining — I stop because I'm trapped. Even when the sun is out and the sky is blue, there are roads sitting under anywhere from two to eighteen inches of standing water with nowhere to drain. It's a genuine nightmare, and it happens in the so-called "dry" winter season. Never in summer.
So I can't hand you inches. But I can tell you, after 20 years, exactly when this town turns into a lake — and it is not the season the weather sites keep warning you about.
And the hurricane fear? The history demolishes it
Every year a storm gets forecast toward the Dominican Republic. Every year Punta Cana is fine. That's not optimism — it's the record. Here is every significant hurricane to strike the DR in roughly the last 130 years:
| Name | Category | Date | Where it hit |
|---|---|---|---|
| Fiona | Cat 1 | Sep 19, 2022 | East coast — Boca de Yuma, La Altagracia |
| Jeanne | Cat 1 | Sep 4, 2004 | NE coast — Samaná & Puerto Plata |
| Georges | Cat 3 | Sep 22, 1998 | Santo Domingo & La Romana |
| Hortense | Cat 3 | Sep 10, 1996 | East coast — Punta Cana to Samaná |
| Gilbert | Cat 3 | Sep 11, 1988 | Barahona, southwest coast |
| Emily | Cat 4 | Sep 22, 1987 | Baní, southwest coast |
| David | Cat 5 | Aug 31, 1979 | Santo Domingo |
| Eloise | Cat 1 | Sep 13, 1975 | Northeast coast |
| Beulah | Cat 4 | Sep 11, 1967 | Barahona, southwest coast |
| Inez | Cat 4 | Sep 29, 1966 | Barahona, southwest coast |
| Edith | Cat 2 | Sep 27, 1963 | La Romana |
| Katie | Cat 1 | Oct 16, 1955 | Barahona, southwest coast |
| San Zenón | Cat 4 | Sep 3, 1930 | Santo Domingo |
| Lilís | Cat 3 | Sep 21, 1894 | Santo Domingo & southwest coast |
Look at the right-hand column. Of fourteen hurricanes in over a century, only two — Hortense in 1996 and Fiona in 2022 — came ashore on the eastern end near Punta Cana. Five of them slammed Barahona, on the southwest coast. Four hit Santo Domingo. The storms aiming at the Dominican Republic don't end up here — they get pushed south and west.
That's not luck. It's the Mona Passage, the channel of deep, warm water between the Dominican Republic and Puerto Rico. Storms tracking up from the south get steered and weakened as they approach, and combined with Hispaniola's massive central mountains, they tend to recurve away — sliding toward the south coast, the southwest, or Haiti. The table bears it out: the hits cluster on the southwest coast and Santo Domingo, not here. Meteorologists have described this corner as sitting in a "hurricane hole."
The most recent one to come close was Fiona, in 2022 — yes, like the dragon in Shrek. It made landfall at Boca de Yuma, in our own province of La Altagracia, only about 50 miles west of Punta Cana, then tracked northwest toward Las Terrenas in Samaná. That's close. We got a tremendous amount of rain and serious flooding, and it knocked down trees all over. The rain comes straight through the walls here — the buildings are porous cement block — so flooding is just part of the deal. And yet, within 24 hours, Punta Cana was completely back to normal. The water was gone, the downed trees and branches had been cut and hauled away, and everyone was back at the pool and the beach like nothing had happened. That is the closest a hurricane has come in my two decades here — and it cost us a single day.
As USA Today has noted, the Dominican Republic actually carries a lower hurricane risk than neighboring Antigua, Jamaica, the Bahamas, the U.S. Virgin Islands, or Puerto Rico. And as Fiona showed, even when one does come close, recovery here is measured in hours, not weeks.
I went looking for the real number. There isn't one.
After all this, I did the obvious thing: I went hunting for the real rainfall record. If the consumer sites are guessing, somebody official must have the ground truth — right?
I had two leads. The first was the World Meteorological Organization's public weather service, which is supposed to carry vetted long-term climate baselines fed in by each country's own meteorological agency. I went to verify it for Punta Cana. I couldn't — the record I was pointed to doesn't hold up, or simply isn't there.
The second is ONAMET, the Dominican Republic's national meteorological office. In theory they're the one body that could keep a real physical rain gauge in this area and log it by hand. So I reached out and asked. As of this writing: silence. I'm following up, but I'm not holding my breath — answering public data requests isn't really what the agency is built for.
So here's where it actually lands. It isn't just that the rainfall data online is modeled instead of measured. The supposedly authoritative ground-truth sources are a dead end too. There is no rainfall record for Punta Cana that I can find — not online, and not in any archive I've been able to reach. That's not a gap I'm willing to paper over with a chart of my own.
It is, though, why I eventually intend to just put a rain gauge in the ground here myself and keep one honest record — kept by someone who actually lives under the sky it measures. Until that record exists, nobody can prove anything about how much it rains in Punta Cana. Including the websites that talk like they already have.
So when should you actually come to Punta Cana?
Honestly? Whenever you can. That's the conclusion the regional data won't let the other blogs reach. Summer here is hot, sunny, and the rain — when it comes — is over in minutes and almost always falls while you're asleep. Winter is gorgeous too, with the occasional flooded street that has nothing to do with the season you were warned about. There is no four-month window you need to avoid, and the hurricane anxiety that scares people off in late summer is, for this exact stretch of coast, almost entirely misplaced.
The water's warm, the sun is out far more than the charts admit, and the "rainy season" you were warned about isn't the one you think it is. When you're ready to get out on that water, browse our charters — we sail nearly year-round, for exactly the reasons above.
FAQ
Is summer really the rainy season in Punta Cana? Not in any way you can prove with data, because no one measures rainfall here. The "rainy season" label is borrowed from Caribbean-wide weather models, not from anything recorded on the ground in Punta Cana. In practice, summer rain here tends to fall in brief showers — often overnight or at dawn — that pass in minutes and dry up almost instantly, rarely costing you any time outdoors at all.
Why do weather sites disagree about how much rain Punta Cana gets? Because none of them are measuring it. There is no rainfall record being kept in the Punta Cana area — the airport station (ICAO MDPC) sends an aviation METAR feed that tracks temperature, wind, and visibility, and notes whether it's raining, but never how much fell. So the figures you see online are filled in from regional stations like Santo Domingo (MDSD) or from satellite models, which is why two major sources can differ by as much as 2x on the annual total for the same town.
Do hurricanes hit Punta Cana often? Very rarely. Of fourteen significant hurricanes to strike the Dominican Republic in over a century, only two — Hortense in 1996 and Fiona in 2022 — came ashore on the eastern end near Punta Cana. The Mona Passage between the DR and Puerto Rico, plus Hispaniola's mountains, tend to steer and weaken storms toward the southwest coast or Santo Domingo instead. And even Fiona, the closest call in 20 years, had the area back to normal within 24 hours.
Does it flood in Punta Cana? It can, and the flooding is usually worse than the rain itself, because the area has almost no drainage. Standing water can linger for days and stacks up cumulatively if it rains again — which is what actually keeps people off the streets in winter. Summer showers, by contrast, are so brief that the pavement is dry again within half an hour.
What's the best time of year to visit Punta Cana? Realistically, almost any time. There is no multi-month stretch you genuinely need to avoid. The water is warm year-round, the sun shines far more than the forecasts suggest, and the rain — when it comes in summer — is a non-event.